Ecommerce

Introduction
In this chapter, we review the state of ecommerce on the web. An ecommerce website is an “online store” that sells physical or digital products. When building your online store, there are several types of platforms to choose from:
- Software-as-a-Service (SaaS) platforms like Shopify minimize the technical knowledge required to open and manage an online store. They do this by restricting access to the codebase and removing the need to worry about hosting.
- Platform-as-a-Service (PaaS) solutions, such as Adobe Commerce (Magento), provide an optimized technology stack and hosting environment while allowing full codebase access.
- Self-hosted platforms, such as WooCommerce.
- Headless platforms, like CommerceTools, that are “API-as-a-service.” They provide the ecommerce backend as a SaaS, while the retailer is responsible for building and hosting the frontend experience.
Note that some platforms may fall into more than one of these categories. For example, Shopware offers SaaS, PaaS, and self-hosted options.
Our goal is to give an overview of the current state of the ecommerce ecosystem as well as its development in the last year. The first part focuses on ranking the platforms based on their usage and Core Web Vitals/Lighthouse performance results. The second part is more experimental. We checked different eCom technologies and how they have evolved over time.
Platform detection
We used an open-source tool called Wappalyzer to detect technologies used by websites. Wappalyzer can identify content management systems, ecommerce platforms, JavaScript frameworks and libraries, and more.
Limitations
Our methodology has some limitations that may affect its accuracy.
Limitations in recognizing ecommerce sites
Firstly, there are some limitations to our ability to recognize an ecommerce site:
- Wappalyzer must have detected an ecommerce platform.
- for this analysis we only analyzed home pages. If the ecommerce platform is hosted within a subdirectory it may be excluded from this analysis.
- A headless implementation reduces our ability to detect the platform in use. One of the primary methods to identify an ecommerce platform is by recognizing standard HTML or JavaScript components. Therefore, a headless website that does not use the ecommerce platform front end makes it challenging to detect.
Accuracy of metrics and commentary
The accuracy of metrics and commentary may also be affected by the following limitations:
- Trends observed may be influenced by changes in detection accuracy rather than reflecting industry trends. For example, an ecommerce platform may appear to become more popular simply because the detection method has improved.
- All website requests were made from the United States. If a website redirects based on geographic location, the final version analyzed will be the U.S.-specific one.
- We used the Chrome UX Report dataset, which includes only data from real-world Chrome sessions, not representing the user experience across all browsers.
Top ecommerce platforms
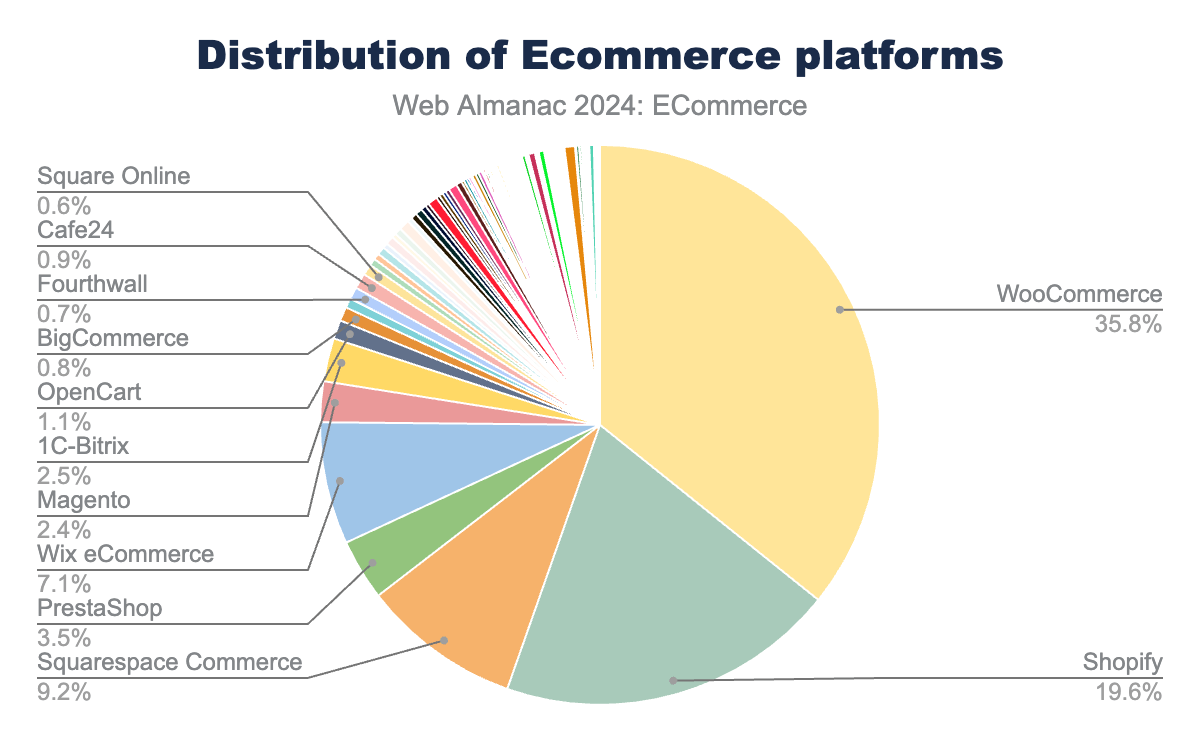
In total, we detected nearly 2.5 million websites built on ecommerce platforms in 2024, representing approximately 21% of all the websites analyzed. The most widely used ecommerce platform is WooCommerce, followed by Shopify and Squarespace.
WooCommerce (36%) and Shopify (20%) dominate the ecommerce platform landscape. OpenCart is the last of the 362 detected shop systems that manage to secure a share above 1% of the market.
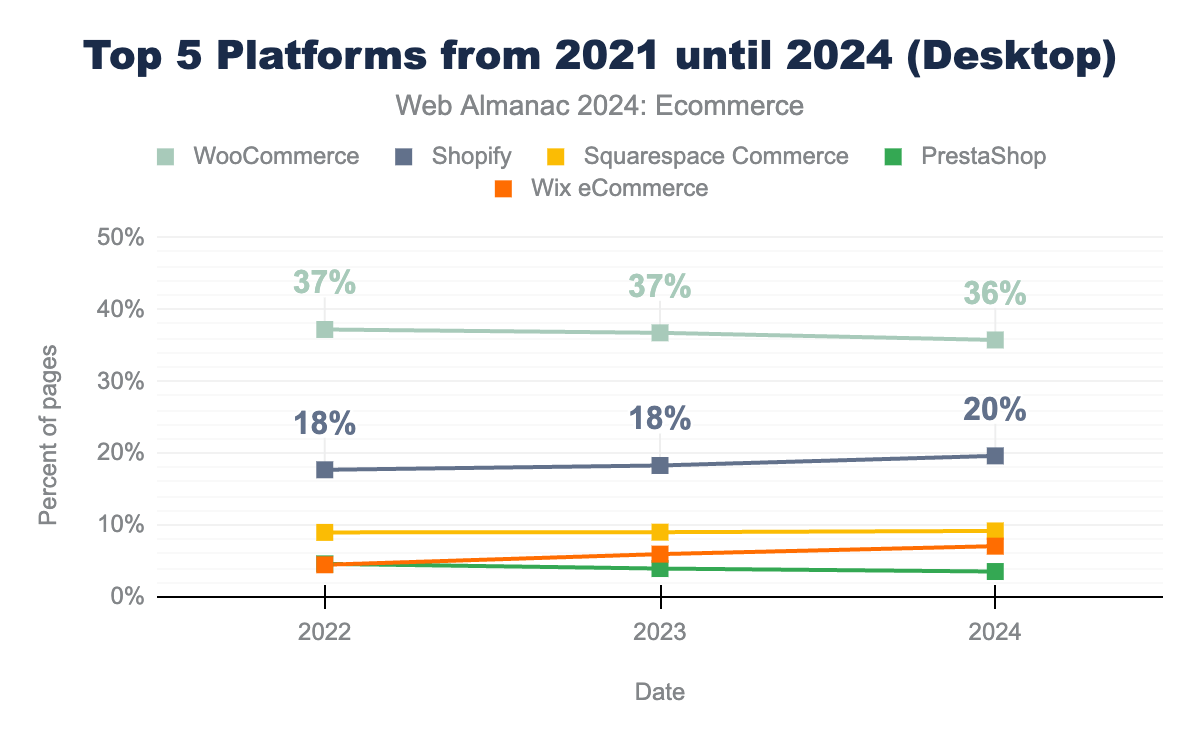
Over the years, the top five platforms have remained relatively consistent. However, Wix ecommerce surpassed PrestaShop in 2023, moving from 5th to 4th place. Trends indicate that the open-source project WooCommerce is slightly losing market share, decreasing from 37% in 2022 to 36% in 2024, while its commercial competitor, Shopify, is gaining market share in the same period (increasing from 18% to 20%).
Top ecommerce platforms by rank
Using the Chrome User Experience Report data, we looked at ecommerce platforms by rank.
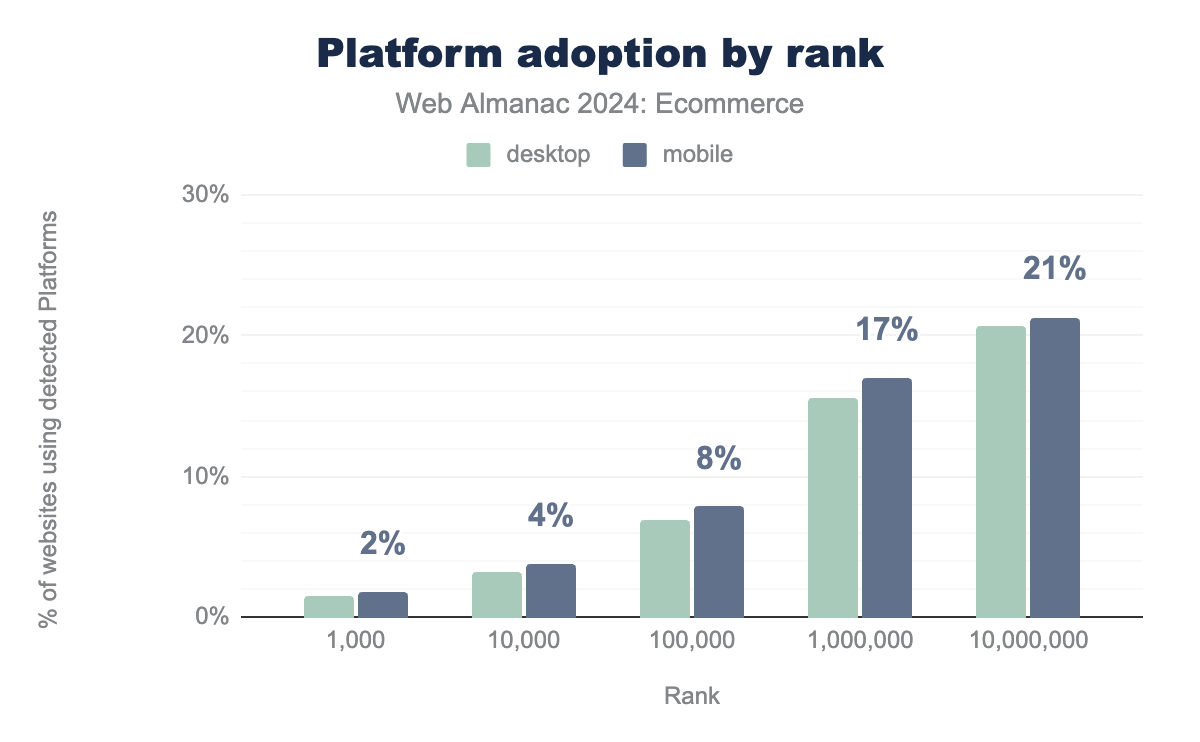
Our data shows that only a few ecommerce platforms are represented in the top 1,000 websites, while about 20% of the top 10 million websites use an ecommerce platform. This difference could be because the top 1,000 sites often use custom solutions.
| Position | 10,000 | 100,000 | 1,000,000 | 10,000,000 |
|---|---|---|---|---|
| 1 | Salesforce Commerce Cloud | Shopify | Shopify | WooCommerce |
| 2 | Fourthwall | Magento | WooCommerce | Shopify |
| 3 | Amazon Webstore | Salesforce Commerce Cloud | Magento | Squarespace Commerce |
| 4 | Magento | WooCommerce | PrestaShop | PrestaShop |
| 5 | SAP Commerce Cloud | Amazon Webstore | 1C-Bitrix | Magento |
Compared to the overall web, there are noticeable differences in platform popularity among the top 10 million websites. For instance, Wix ecommerce loses its position in the top five platforms, while Magento joins the top five. In the top one million sites, Shopify overtakes WooCommerce as the most popular platform, while Squarespace and Wix ecommerce fall out of the top five and below the top 20.
In the top 100,000 websites, Salesforce Commerce Cloud and Amazon Webstore emerge among the most used platforms, with Shopify still holding the number one spot. Finally, in the top 10,000 websites, none of the previously leading platforms are represented in the top five, which are instead dominated by commercial solutions such as Fourthwall, SAP, and Salesforce Commerce Cloud.
Top ecommerce platform by geography
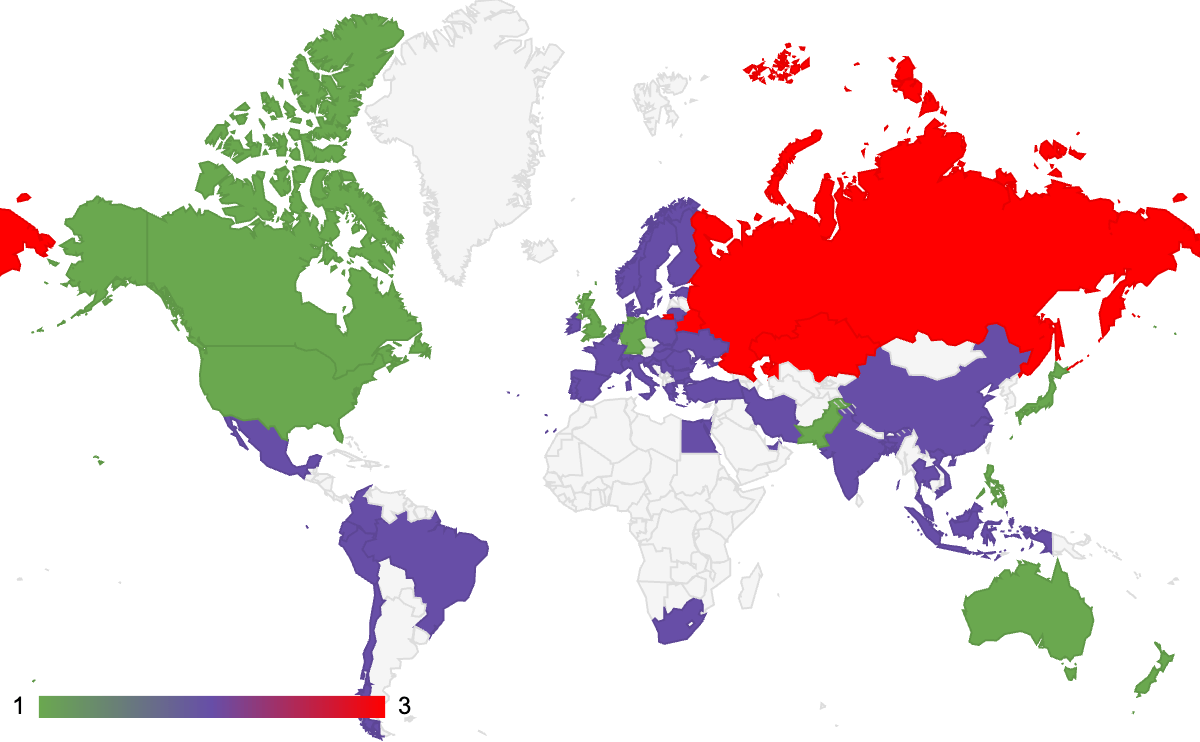
There are quite a few differences in preferences between geographies. We used additional data from the CrUX dataset, which categorizes the most visited websites per geographical area. For example, google.com, while an American website, is also one of the most visited websites by all German internet users.
We can see that three leading platforms take the top spot in each country: WooCommerce (violet), Shopify (green), and 1C-Bitrix (red). The map visualizes only these three due to the limitations of Google Sheets.
Core Web Vitals in ecommerce
Google’s Core Web Vitals are three key performance metrics designed to evaluate crucial aspects of user experience, focusing on loading speed, interactivity, and visual stability. Introduced in 2020 and adopted as a ranking signal in 2021, those metrics, among many others, determine how high a page is ranking in the Google search results.
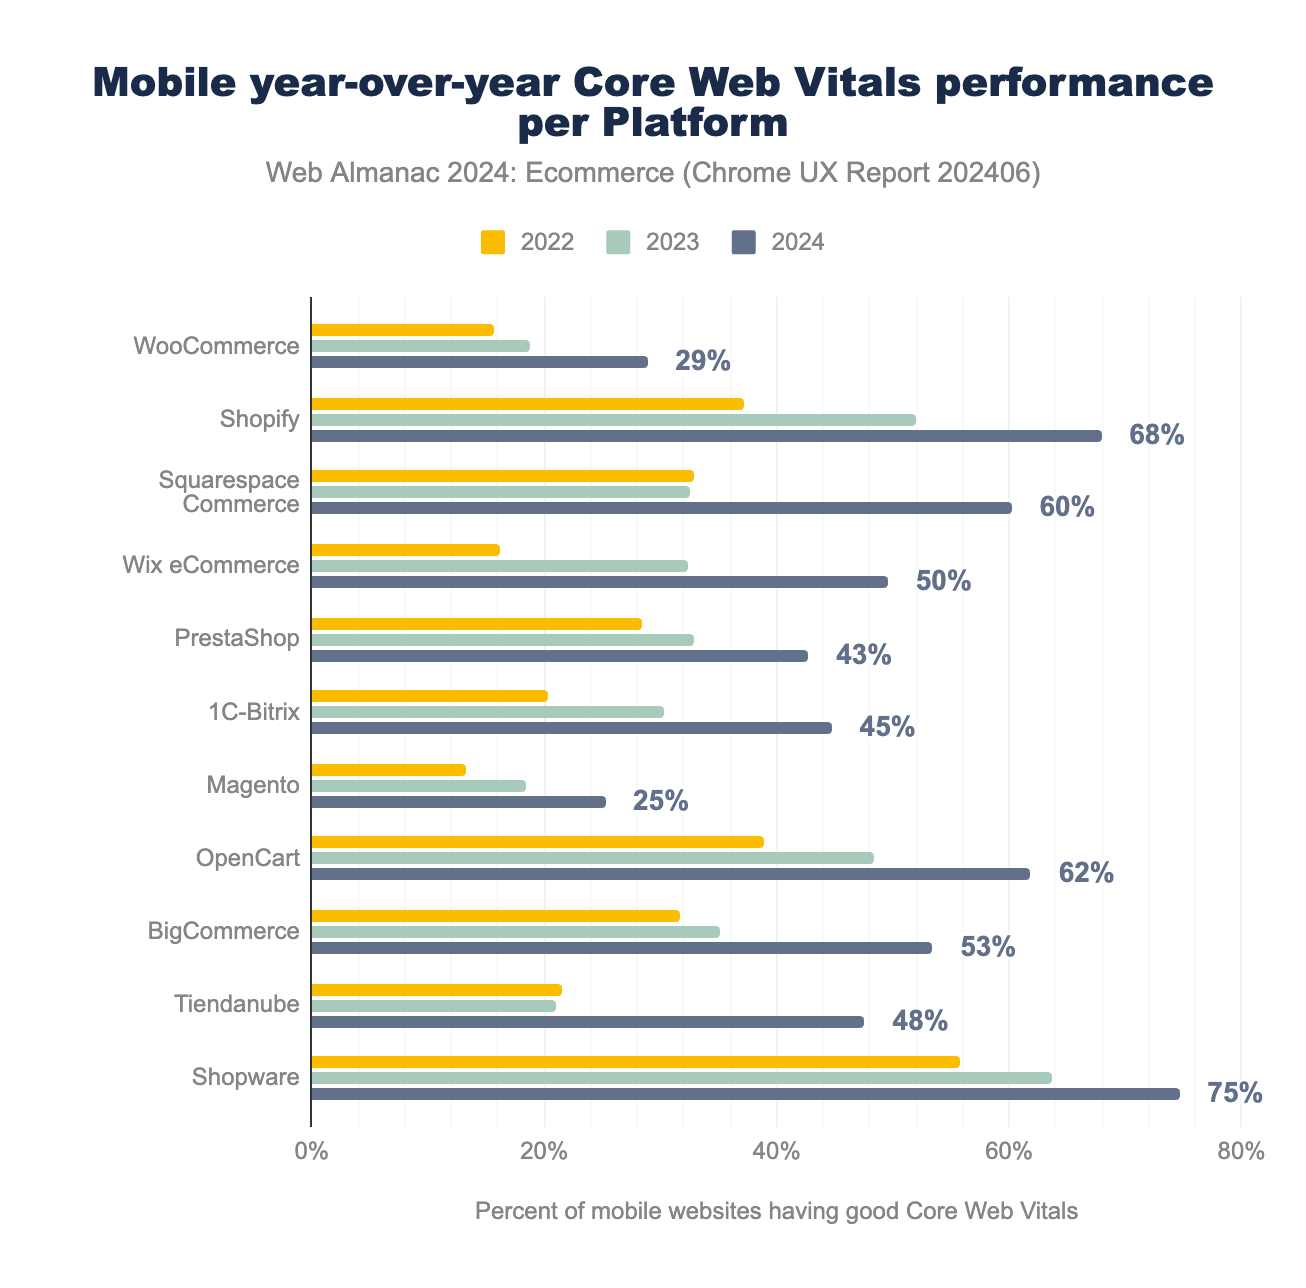
Here’s the percentage of sites on each platform that achieve a “good” score, meaning they meet the performance thresholds for all three Core Web Vitals: LCP (Largest Contentful Paint) under 2.5 seconds, INP (Interaction to Next Paint) under 200 milliseconds, and CLS (Cumulative Layout Shift) below 0.1.
- LCP under 2.5 seconds: This measures how long it takes for the largest visible element on the page to load. Achieving this threshold ensures users can view the main content quickly without excessive delays.
- INP under 200 milliseconds: This measures the time from a user’s interaction (such as a click or tap) to the browser updating (or painting) the screen. A score under 200 milliseconds means the page is highly responsive and provides a smooth user experience.
- CLS below 0.1: This tracks the visual stability of the page by measuring how much elements move unexpectedly as they load. A score below 0.1 indicates minimal shifts, ensuring a more stable visual experience for use.
Some platforms made impressive improvements, like Squarespace, which increased from 33% good scores in 2022 to 60% in 2024. Other platforms, like Magento and WooCommerce, are still struggling with real-world user experiences. This chart, and the other charts of this section, consider mobile performance only since most web traffic comes from mobile, and it’s more challenging to reach top scores.
Largest Contentful Paint (LCP)
Largest Contentful Paint (LCP) measures how long it takes for the main content of a webpage to load and become visible to users. It specifically tracks the loading time of the largest element on the screen, like a big image or a block of text, which makes it a good indicator of how quickly users can see something meaningful on your page.
A good LCP time should be under 2.5 seconds. If it takes too long, it can make the website feel slow, and users might leave. To improve LCP, you can optimize images, make server responses faster, and minimize blocking scripts so that key content shows up more quickly.
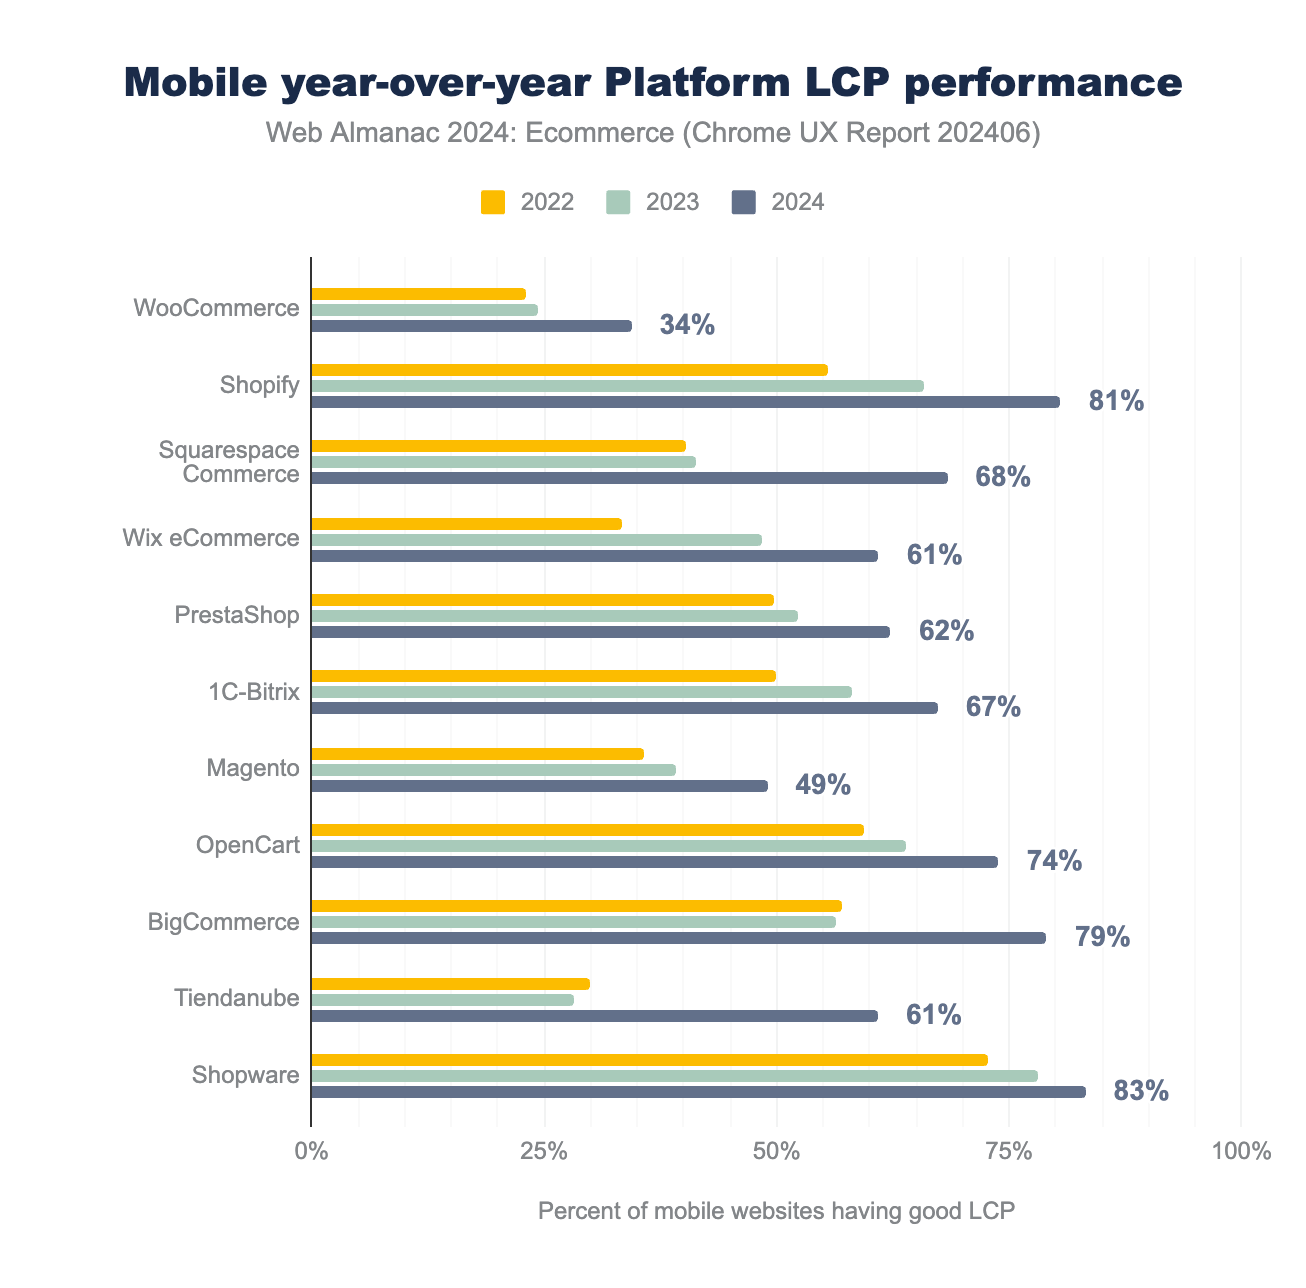
Despite these challenges, the top 10 ecommerce platforms have shown significant year-over-year improvements in their LCP scores. Platforms like Shopify, OpenCart, and Shopware have consistently had good LCP pass rates since 2022, while Tiendanube, a popular platform in Argentina, made impressive progress, increasing its pass rate from 28% in 2022 to 61% in 2024. On the other hand, WooCommerce lags behind with a pass rate of just 34%.
Cumulative Layout Shift (CLS)
Cumulative Layout Shift (CLS) measures how stable the layout of a page is by tracking how much content unexpectedly shifts as the page loads. A good CLS score means that 75% or more of a website’s visits register a score of 0.1 or lower, indicating a stable, user-friendly experience.
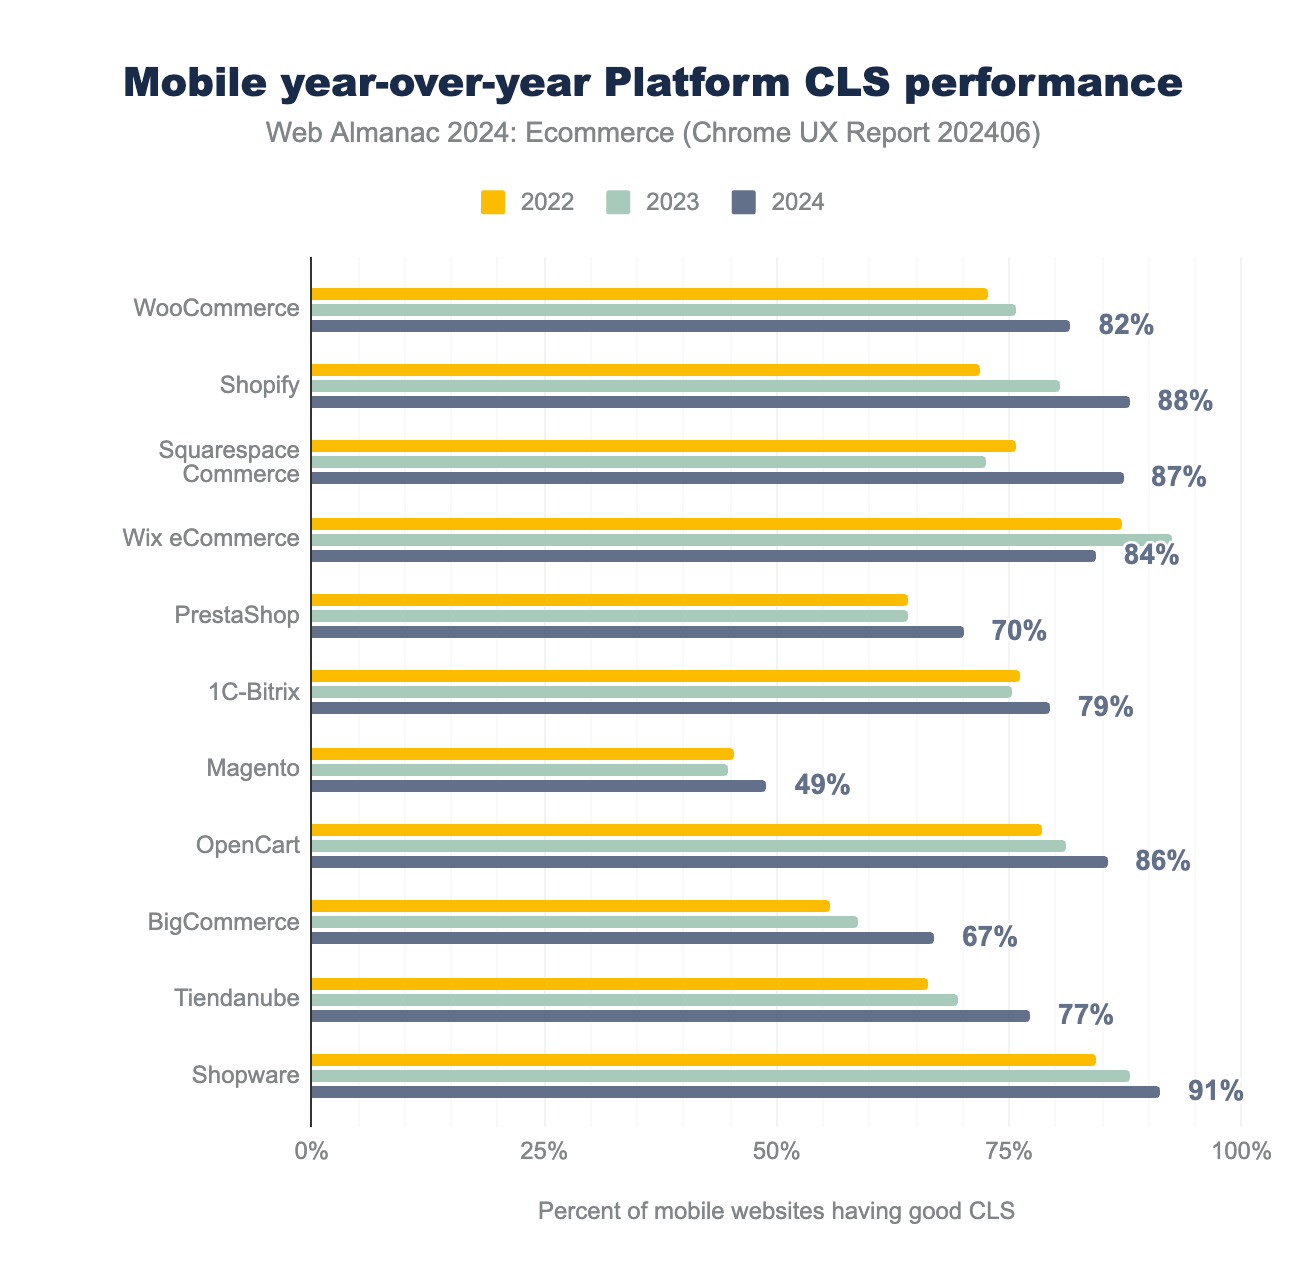
In comparison to LCP, improvements in CLS have been less dramatic. Many platforms have only made modest progress, with Magento struggling more than others. WooCommerce, while facing challenges in other metrics, performs exceptionally well in CLS, similar to many other platforms.
Interaction to Next Paint (INP)
INP captures the time taken from the moment a user interacts with a page (e.g., clicking a button) to when the browser visually responds to that interaction. A good INP score is 200 milliseconds or less, which ensures a smooth and responsive experience.
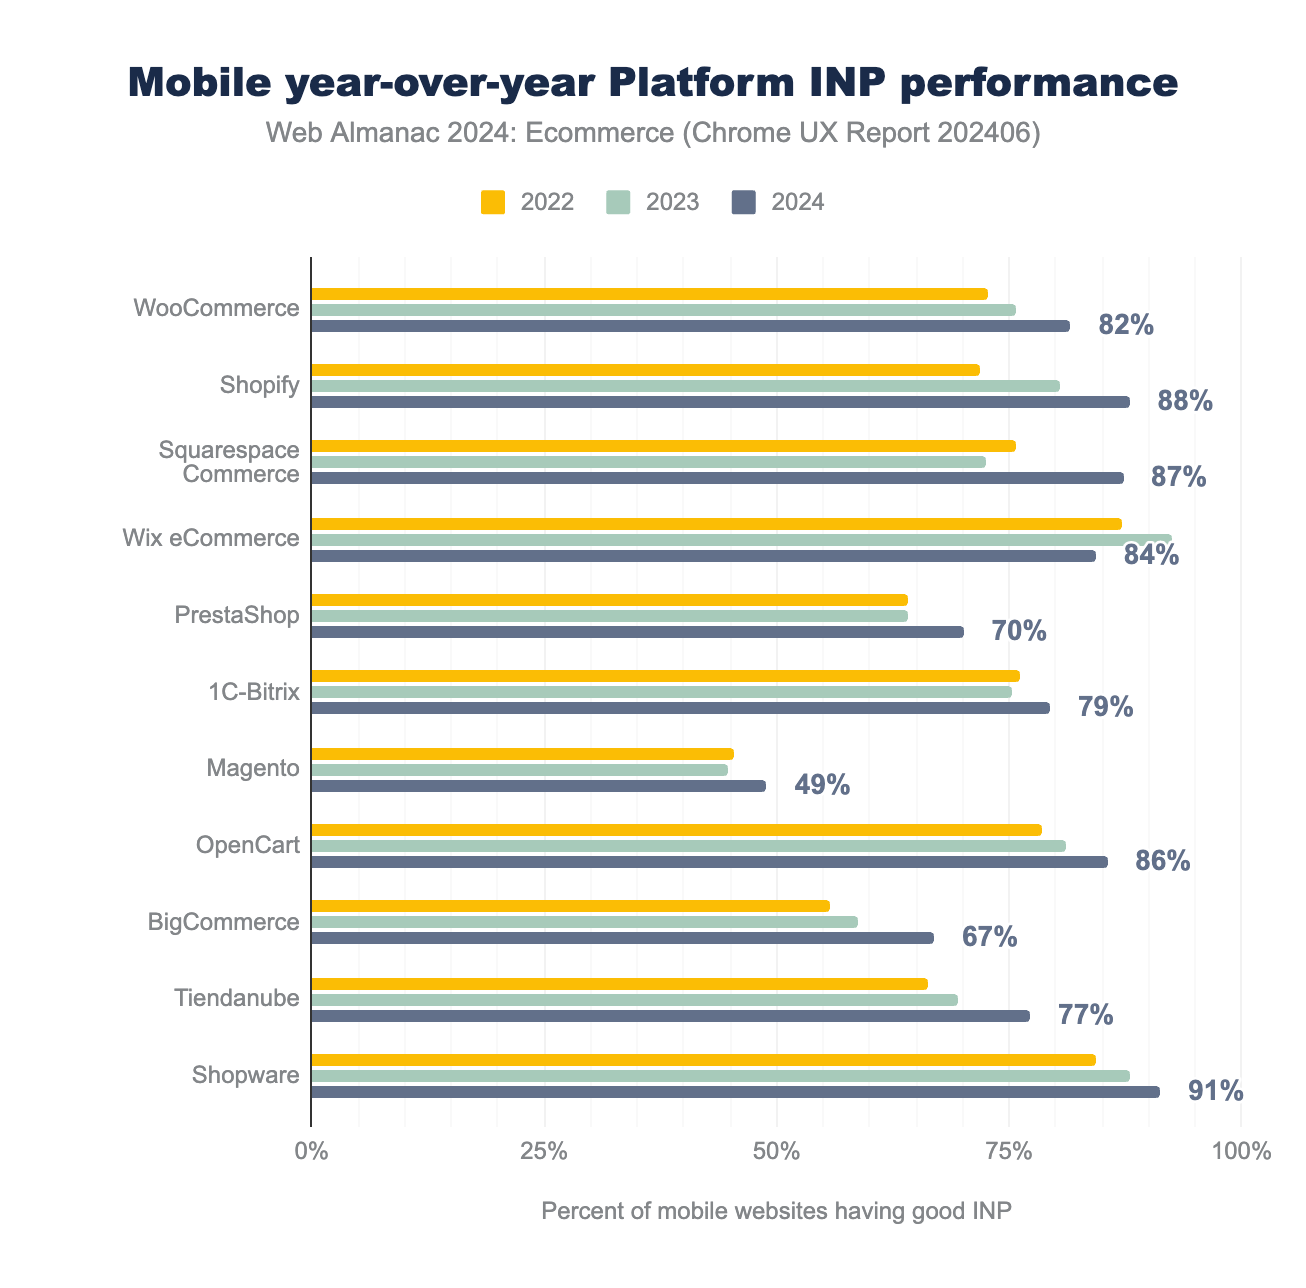
While most platforms have improved their INP scores, some still lag behind, including Magento and BigCommerce, with pass rates of 49% and 67%, respectively. However, most platforms have a pass rate above 75%, indicating substantial progress across the industry.
Lighthouse
Lighthouse is an open-source, automated tool for auditing web page quality. It provides metrics and reports on aspects like performance, accessibility, best practices, and search engine optimization (SEO).
It generates reports with lab data that offer developers actionable suggestions for enhancing websites. However, it’s important to note that Lighthouse scores do not directly impact the real-world field data collected by CrUX. The HTTP Archive runs Lighthouse on mobile and desktop web pages, simulating a slow 4G connection with throttled CPU performance. Lighthouse Performance is a lab-based assessment of website performance tailored to specific test profiles for desktop and mobile users. To better understand the differences between both metrics, refer to this article.
While Core Web Vitals offer real-world data, they provide a limited set of metrics. Lighthouse, on the other hand, gives us lab data for a wide variety of metrics. You can also run a Lighthouse test for this page using Chrome DevTools. In the following section, we focus on ecommerce systems that were detected more than 50,000 times to emphasize the systems people commonly use and recognize in our charts. However, the complete data is available in the sheets, and for exceptional cases, we also mention smaller shop systems.
Performance
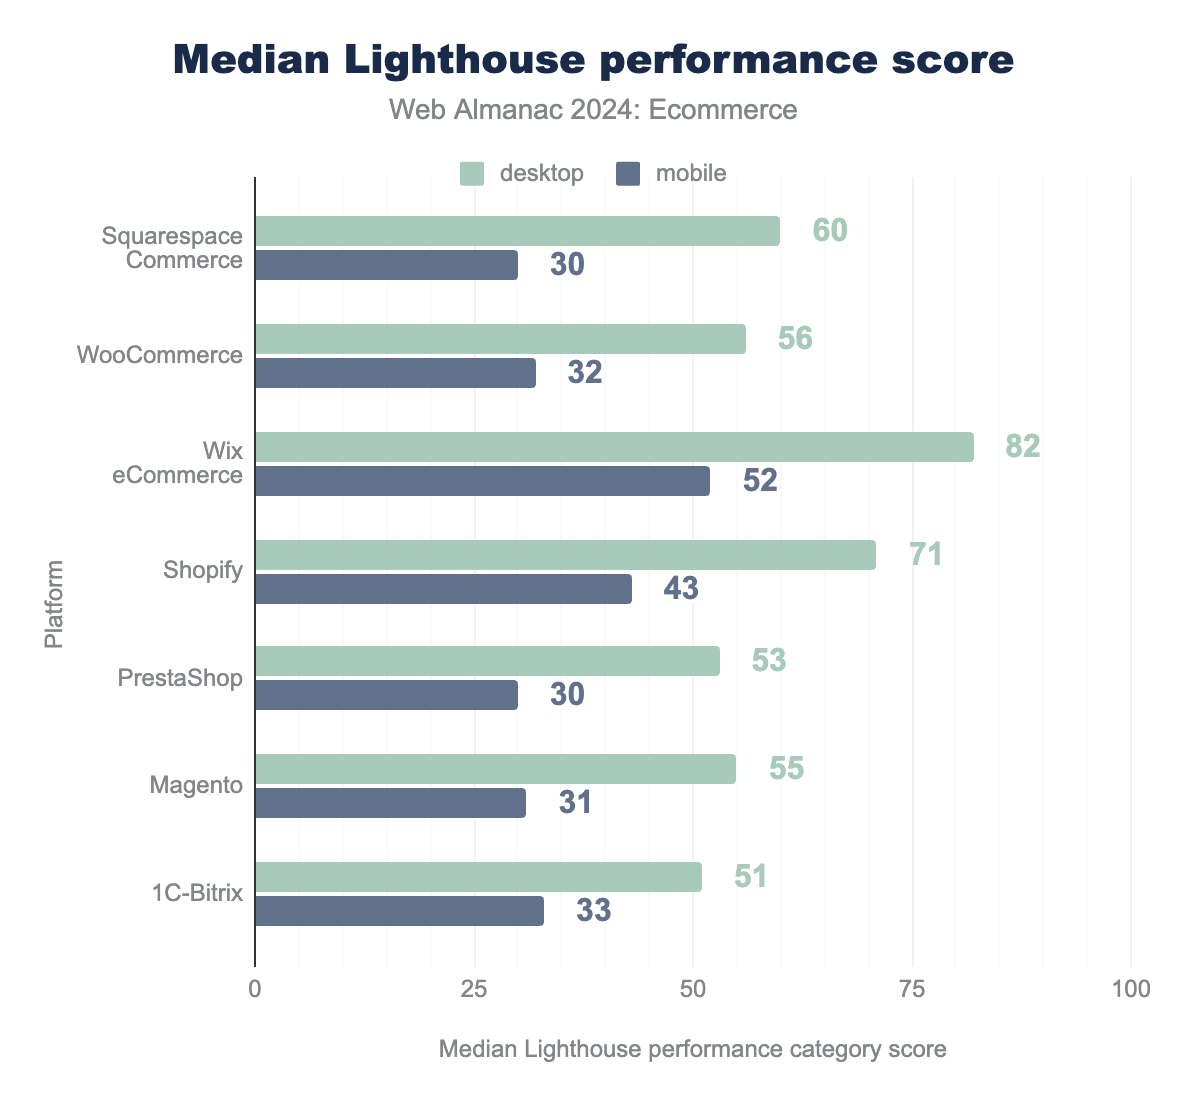
The Lighthouse performance score is a metric that summarizes the overall performance of a web page, mainly focusing on how quickly and smoothly it loads and becomes usable for visitors. This score ranges from 0 to 100, where higher scores indicate better performance.
The Lighthouse performance score is a weighted average of the five metric scores—First Contentful Paint (10%), Speed Index (10%), Largest Contentful Paint (25%), Total Blocking Time (30%), Cumulative Layout Shift (25%).
We can see that Wix ecommerce performs very well on both desktop and mobile compared to other systems. This is surprising, as the ranking data shows that it is primarily used for websites outside the top 10 million, which are likely less professional stores. This performance could also be due to the limited customization options compared to open-source systems like WooCommerce.
If we lower the threshold to platforms that appear at least 5,000 times instead of 50,000 times, Gumroad scores very well, with a median score of 87 on desktop and 59 on mobile. Additionally, Argentina’s most popular shop system, Tiendanube, also scores well, with 74 on desktop and 58 on mobile.
Accessibility
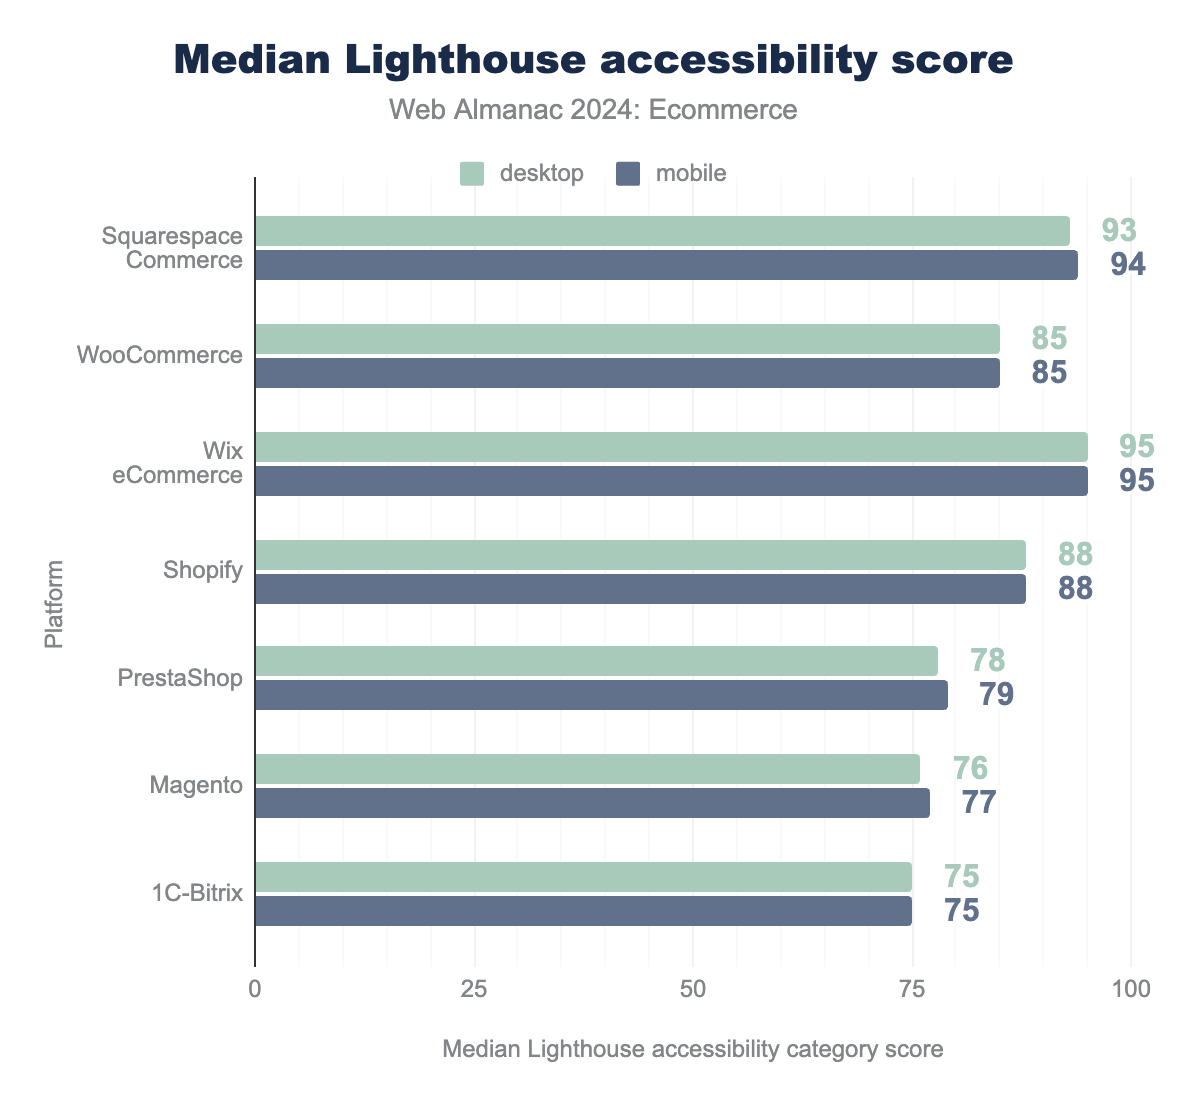
Accessibility is an increasingly important topic, not just for moral reasons but also for legal reasons. Lighthouse uses the Axe framework to determine the accessibility score. The accessibility score shows how easy it is for everyone, including people with disabilities, to use your website. The score ranges from 0 to 100, with a higher number meaning the website is easier for more people to use.
The score is based on a series of tests. For example, it checks if images have descriptions for people using screen readers and if buttons are clearly labeled. It also looks for issues like proper use of headings and good color contrast to ensure the website is understandable and easy to navigate. We also have an entire chapter dedicated to accessibility that goes into more detail.
It’s important to note that a good accessibility score does not necessarily mean the website is fully accessible, as many problems cannot be detected by automated tools. For example, an incorrect description of an image is an issue, but Lighthouse won’t flag it.
The commercial platforms Wix, Squarespace, and Shopify perform well, while none of the systems have a notable bad result.
SEO
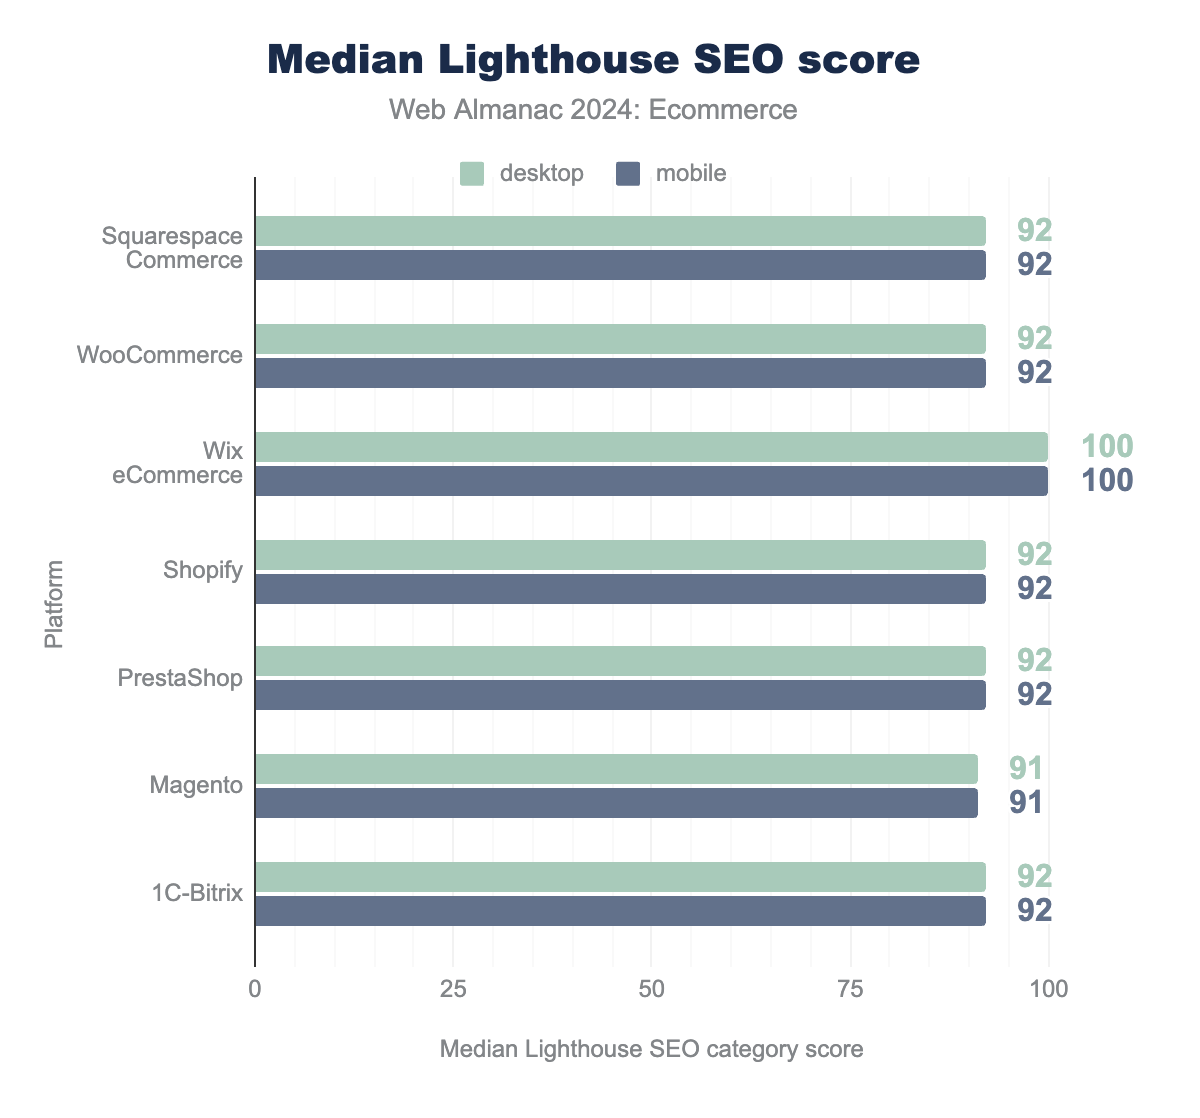
The Lighthouse SEO score shows how well a website is set up to be found by search engines like Google. The score ranges from 0 to 100, with a higher score meaning a site is better optimized for search engines, which helps more people find it. The test checks for meta description, title, and correct headings structure.
The importance of SEO is reflected in the lighthouse results since most platforms score really well, led by Wix, which has a perfect median score of 100.
Best practices
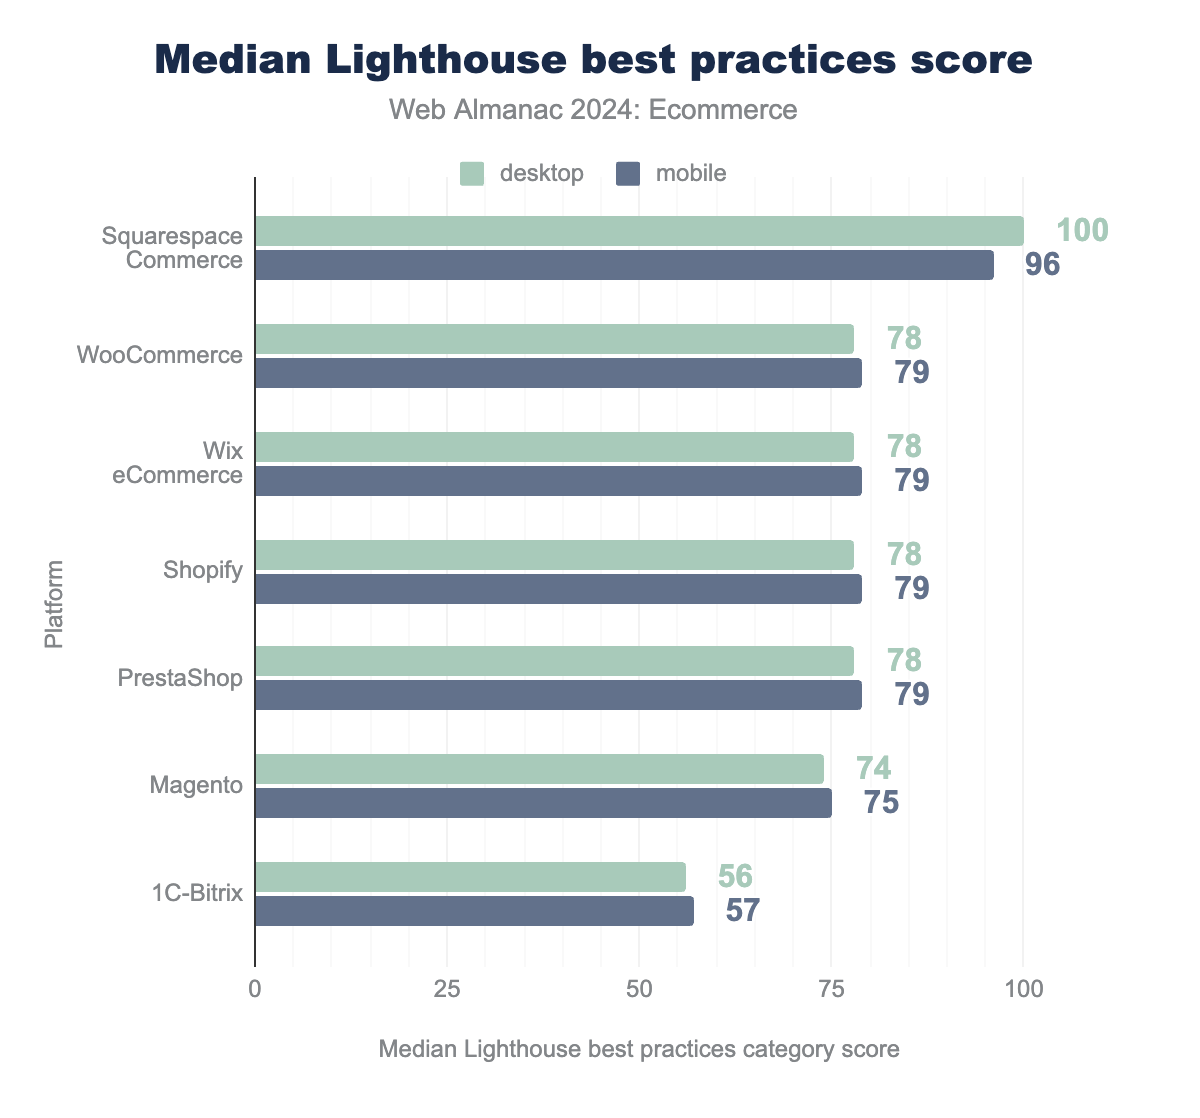
The Best practices score shows how well your website follows general rules for good web development, focusing on making the site secure and reliable. It checks things like whether your site uses secure HTTPS connections, if JavaScript features are used safely, and if images and resources load properly. The goal is to ensure your website avoids common problems that could make it less secure, slow, or unreliable for users.
Squarespace is leading by far among platforms with more than 50,000 pages in our dataset, with a 22-point difference over the second place, WooCommerce.
Payment providers
The detection of payment providers is not as advanced or precise as the detection of different ecommerce platforms. This may be because we only analyzed the home page rather than the entire website, which might not provide clear indications of the payment providers used. You can refer to the checkpoint on the Wappalyzer GitHub profile to understand how different payment providers are detected. Multiple payment providers can be used on the same website. In such cases, the website is counted for each payment provider detected.
The following section focuses on each website with detected payment providers, even if no ecommerce system was identified.
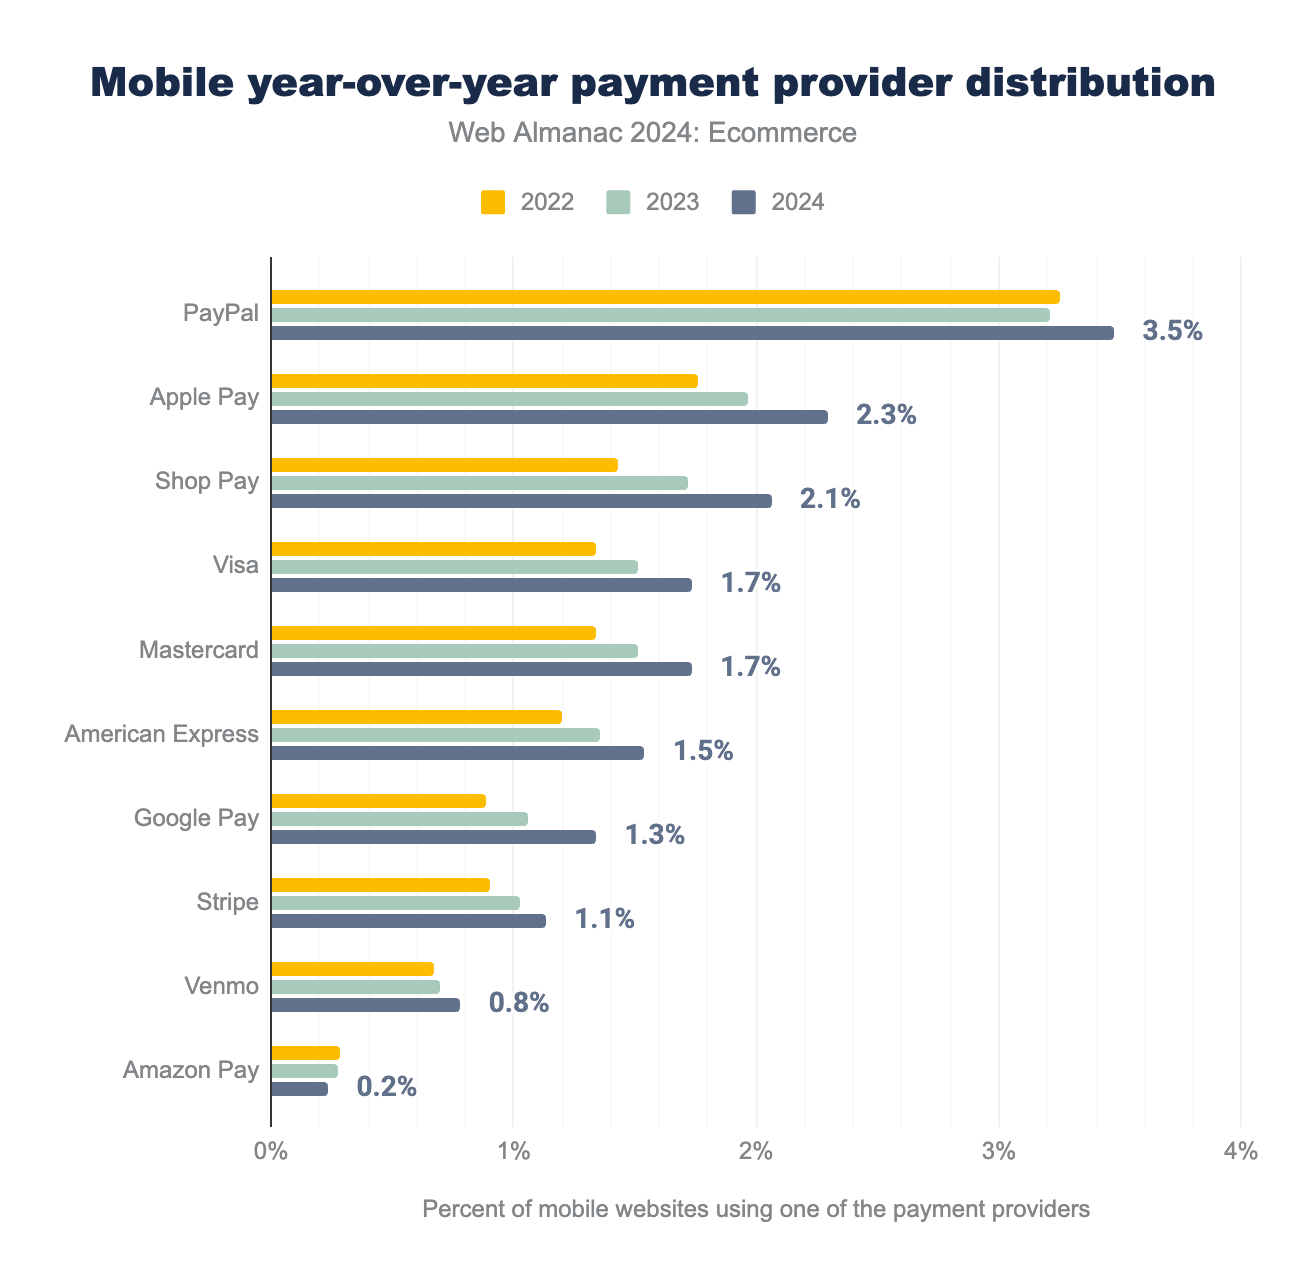
The data reveals that PayPal is the most commonly detected payment method on mobile websites, appearing on 3.5% of all pages in the dataset. This means PayPal was found on approximately 560,000 mobile pages out of more than 16 million analyzed.
Apple Pay ranks second, being detected more frequently than Google Pay, which shows its growing presence in mobile ecommerce. Meanwhile, Shop Pay, a payment solution provided by Shopify, secures third place in the rankings.
Conclusion
Ecommerce is still evolving, with platform preferences varying by region and website size. While WooCommerce remains the go-to platform for many, Shopify has steadily gained ground, especially among higher-traffic websites. Interestingly, platforms like Wix ecommerce perform well in terms of user experience metrics despite being more popular with smaller sites. Overall, we can observe improvements in most metrics, from performance to accessibility, over the past few years, benefiting everyone.
While ecommerce platforms are diverse and well distributed among different providers, a few key players dominate technologies like payment systems. It will be interesting to see how this landscape continues to evolve in the coming years.
